AIM13 Commentary - 2018 Q1
“I wish there was a way to know you're in the good old days before you've actually left them.”
– Andy Bernard, The Office
May 21, 2018
Dear Investor,
We were thrilled to see so many of our partners, managers, and friends at our 15th Annual Partners Meeting last Friday. We hoped you all enjoyed the conversation with Ken Langone, co-founder of The Home Depot and author of the recently released book, “I Love Capitalism!” We were also fortunate to have the following speakers: Scott Ferguson (Sachem Head Capital Management), Matt Iorio (White Elm Capital) and John Shulman (Juggernaut Capital Partners).
With the return of volatility in the first quarter this year, we are not surprised to see investors grow more pessimistic than they have been for some time. Indeed, Forbes reported on April 19th that expectations that stock prices will fall over the next six months jumped recently by 6.1% to 42.8%. Pessimism has not been this high in over a year. What does surprise us, however, is that the growing negative investor sentiment is not necessarily translating into investor action. Despite higher volatility (which many equate with risk), equity fund flows remain stable, if not strong. In fact, they are on track to outpace flows into bond funds for the first time since 2013, according to a report by the Wall Street Journal in late March. What does this tell us? We believe investors do not want to accept the consequences of being in the final stages of an almost unprecedented bull market. We view this as symptomatic of a larger trend that goes beyond stock prices, namely, a “kick the can down the road” mentality that only delays a reckoning we all know will happen at some point.
After the unusual calm of 2017, the return of volatility in 2018 has struck some investors as something like the return of Jack Nicholson in The Shining:
Volatility in 2018…

Somewhat counter intuitively, however, when it comes to risk management, it seems that the majority of investors are not as spooked as we were watching that film in 1980. As we alluded to above, many have been increasing exposure to equity and, to a lesser extent, bond funds, while primarily reducing allocations to defensive investments and money market funds. According to a May 3rd report from OppenheimerFunds, after February and March saw $13 billion in combined net outflows from ETFs, investors poured almost $30 billion of net inflows into ETFs in April. Increasing long only equity and reducing cash and cash equivalents now puzzles us because we believe that the consequences of market and economic dynamics since the financial crisis must come home to roost at some point. In short, now is not the time to become less defensive.
“Everybody, sooner or later, sits down to a banquet of consequences."
- Robert Louis Stevenson
As we have said before, we are not smart enough to know whether we are in the early innings of a correction, or just experiencing another “head fake” like we saw in early 2016, August-September of 2015, and in any of a number of minor pullbacks since the market bottomed out in March 2009. We do believe, however, that investors are underestimating risk. At our annual meeting in 2014, we included the graphic below to illustrate a truism that we often use:
Just because you got away with it
doesn’t mean you didn’t take any risk…

What was true four years ago rings even more true today: investors have enjoyed strong equity market returns without knowing the risks, and no one wants the party to end. We talked about this last quarter in the context of a “fear of missing out.” Through the five years ending March 31, 2018, the S&P 500 TR has annualized at 13.3%. (Incidentally, about five years ago in March 2013, the S&P regained its previous high set in October 2007.) What has driven markets since then? Many observers point to loose monetary policy, with the Fed keeping interest rates low, and Congress allowing the national debt to spike to unprecedented levels. (The Treasury Department reported in mid-March that the U.S. gross national debt jumped by $72.8 billion in just one day). As shown in this chart from March 16, we think the national debt crisis is one of the biggest ticking time bombs of all:
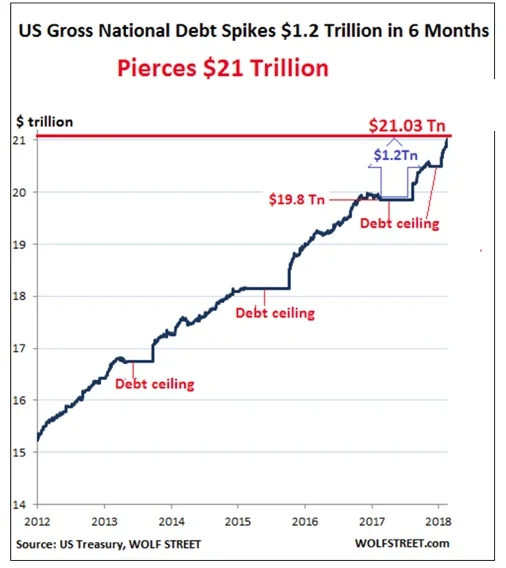
A ballooning national debt has major economic consequences. The Congressional Budget Office’s 2015 Long-Term Budget spells it out very clearly: increasing federal spending on interest reduces the government’s ability to pay for programs, causes private investment to go down, and lessens policymakers’ ability to use fiscal policy to respond to unexpected challenges. As a result of Trump’s tax reform and the two-year budget agreement, the United States is now on track to run budget deficits of more than $1 trillion over the next three years, according to IMF calculations. Indeed, according to the IMF’s April report, among advanced economies, only the United States is expected to increase its debt-to-GDP ratio by 2023. That is not our idea of “American exceptionalism”!
There are so many ways to look at national debt, but a few stand out to illustrate just how extreme our situation is. One is the spike in aggregate debt as a share of revenue and the related exponential growth in debt service:

Source: Moody’s
Another way to look at national debt is to consider debt service (interest) as a component of the nation’s budget. According to research by the Congressional Budget Office, over the next 30 years, interest costs are projected to become the largest category of federal spending:

Source: Congressional Budget Office, Peter G. Peterson Foundation
We believe that growing national debt in a rising rate environment can be a toxic combination for the equity markets. In April, the 10-year Treasury yield rose above 3% for the first time since the end of 2013. JP Morgan CEO Jamie Dimon expects even higher rates, with the possibility that yields could soon reach 4%. We have not seen that level since 2010. “I think people should be prepared for that,” he said in an interview on May 7th. Unfortunately, we do not think they are. Indeed, Alan Greenspan told Bloomberg TV in January that, “As a share of GDP, debt has been rising very significantly, and we’re just not paying enough attention to that.” It is the latter part of that statement that we feel most strongly about. Not only are we facing a looming national debt crisis, what is worse, we are not even really talking about it!
Many investors who have enjoyed strong returns in the equity markets do not realize the risks they are taking maintaining significant allocations to long-only, unhedged equity investments. Moreover, as the financial crisis fades into distant memory, a whole generation of money managers who never experienced a severe correction has come of age. Indeed, according to David Rosenberg of Gluskin Sheff, more than 13 million professionals have entered the financial services industry since the end of the financial crisis (March 2009). As a result, beyond the “older” generation of investors who have experienced risk and are now ignoring it, there are also a lot of people without even the firsthand experience of the consequences of risk-taking.
“Reversion to the mean is the iron rule of the financial markets.”
- John C. Bogle
Newton’s third law of physics is that for every action, there is an equal and opposite reaction. Applied to the markets, over time, as John Bogle observed above, countervailing forces cause things to revert to the mean. Put another way, everything has its consequences. Eventually, you need to pay the piper. Unfortunately, we think many investors are ill prepared for what is to come.
* * *
Due Diligence Tip
If you have not seen your friends who are investment management auditors and accountants recently, you can blame the fact that we are in the middle of financial statements season in our industry. As our operational due diligence team combs through our underlying funds’ audited financials we are now receiving on an almost daily basis, we thought it might be helpful to highlight some of the things we focus on beyond the line item fund data itself. While these questions are just a part of our audited financial statement review, we find that drilling into these areas often yields insights into a fund that uniquely enhance our understanding of the manager.
Audited Financial Statements (AFS): A Few Things We Look For
Overview
- Do the auditor and service providers match our operational due diligence questionnaire?
- Was the timing of the report the same as the prior year or was there a delay?
- Do the asset numbers match the reporting we receive directly from the manager?
Terms
- Are there share classes that we are not aware of, or have any terms changed?
- Are the redemption terms consistent with our records?
- Does the defined set of investments match the PPM?
Capital Changes
- Were the capital flows (in/out) consistent with what we had been told in our ODD meetings?
- How has GP and internal capital changed?
- For managers claiming to be closed, do we see inflows?
- How much of the incentive allocation was re-invested?
- Are there material subsequent redemptions/subscriptions?
Holdings
- Does the percentage breakdown of securities indicate anything unexpected?
- Are the holdings consistent with 13F filings and manager tearsheets?
- Are there Level II and Level III (i.e., less liquid) holdings? Have they changed over time?
- Do we see any unexpected embedded leverage in derivatives’ notional and fair values?
Performance
- Are the investment appreciation figures (returns) consistent with the manager tearsheets?
- Is the character of income in line with expectations?
- Is new issue income significant?
- How do realized and unrealized gains compare?
- Were the realized versus unrealized gains consistent with the LP K-1’s?
Other Items
- Are there any surprises in the related party transactions?
- Has the level of private investments changed? How are privates valued?
- What is included in “other expenses”?
- How are startup costs being amortized?
- How are expenses allocated among funds?
- Comparing onshore and offshore funds, are there any unexpected differences?
We firmly believe that “the devil is in the details,” and when it comes to fund audited financial statements, we aspire to be like Warren Buffett sitting down to read a 10-K. Too often, with new and current managers, we find things we do not expect.
* * *
Market Observations
When we talk about being concerned about the markets, here are some of the things we are seeing in addition to the ballooning national debt discussed above:
- The Corporate Debt Picture Worsens. According to a report in the Financial Times in March, the portion of the corporate debt market rated at BBB, which is the rating just above “junk,” now stands at 48% of the total investment-grade market, based on data from ICE BofAML Indices. Jonathan Duensing, portfolio manager with Amundi Pioneer Asset Management, said recently, “There’s been an overall credit-quality degradation taking place within the investment grade market.” More leverage on corporate balance sheets means that buyers of lower tiers of investment-grade debt may not be compensated enough for the risk of rising leverage. This is not a good thing.
Debt Trends Over the Last Decade:
BBB-Rated Bonds Have Grown to More Than Twice the Size of the High Yield Market (Trillions)

Source: Financial Times, ICE BofAML Indices
Not only has there been a degradation in the quality of corporate debt, but we have also seen aggregate debt levels as a percentage of GDP reach levels not seen since prior credit cycle peaks that have come before major market pullbacks:
U.S. Corporate Debt as a Percentage of GDP

Source: Haver Analytics, Gluskin Sheff
Warning of the possibility of a “severe sell-off” in the corporate bond market, Peter Garnry, head of equity strategy at the Danish Saxo Bank, sounded an alarm in the bank’s 2018 Q2 outlook report: “Caution is critical in such an environment and portfolio diversification and defensive choices therefore make sense.”
- Oil Prices Rise. Oil prices have been rising fairly steadily since the middle of last summer and just recently topped the $70 mark for the first time since 2014. The primary cause has been the curb in output under an OPEC and non-OPEC accord led by Saudi Arabia and Russia, coincidentally at a time of surging demand from widespread global economic growth. As a recent article in Zero Hedge observed, $70 happens to be at the 50% retracement level between the August 2013 high and the February 2016 low:

Source: Zerohedge
Throw in the uncertainties associated with the looming reinstatement of Iranian sanctions and Venezuela cutting production as it deals with its own economic crisis, conditions are ripe for oil prices to rise even further. We believe this will only contribute to more stock market volatility.
- A Spike in Retail Bankruptcies. According to an April report from Moody’s, in the first quarter 2018, retailers filed for bankruptcy at the fastest rate ever as shopping habits in America change rapidly, mall traffic is way down, and years of aggressive growth leave stores empty and losing money fast. Just four months into the start of 2018, eleven major U.S. retailers have already filed for bankruptcy or announced liquidations. Such well known stores such as Claire’s, Nine West, Bon-Ton, and Toys R Us are among them. This “brick & mortar meltdown” is just a part of an overall grim picture for Chapter 11 bankruptcies:

Source: Wolfstreet.com, American Bankruptcy Institute, Zerohedge
Many view this spike as a clear indicator that we have reached the end of this credit cycle. As the credit contagion spreads (subprime auto-loan delinquencies recently surged to the highest rate since October 1996, according to a report on Zero Hedge), we expect to see more sectors experiencing the pain of major retailers.
Yet Another Bad Trend
Mark Twain once quipped, “When angry, count to four. When very angry, swear.” From the chart below, which is based on a search of earning call transcripts, it seems corporate executives are getting angrier every year:

Source: Sentieo
Apparently, among corporate executives more inclined to use colorful language is Jim Hageborn, the CEO of fertilizer group Scotts Miracle-Gro. Granted, his company’s products provide an easy platform to be crude (he told investors on a call recently that “acquiring s**t is fun”). Unfortunately, the trend towards more swearing on corporate conference calls might just be another indication that things indeed are getting uglier out there.
We welcome any questions or thoughts you may have.
Sincerely,
Alternative Investment Management, L.L.C.