
AIM13 Commentary - 2017 Q4
“The minute you get away from the fundamentals – whether it’s proper technique,
work ethic, or mental preparation – the bottom can fall out of your game.”
- Michael Jordan
February 22, 2018
Dear Investor,
On January 26th, the Wall Street Journal ran a story about bankers at Davos with the headline, “Can Anything Stop the Good Times?” That giddiness now seems a distant memory with stocks in the first weeks of February in a period of volatility not seen since 2015. The wild swings in prices have come as a surprise to many investors; the smart bankers, politicians, and policymakers in Davos apparently as caught off guard as anyone else. What is most surprising to us was the complacency before the storm. In our opinion, for some time, many investors have been ignoring fundamentals and making investment decisions for the wrong reasons. As Michael Jordan observed, when you get away from fundamentals, “the bottom can fall out.” Indeed, when the Dow shed 1,175 points on Monday, February 5th, for many investors, it felt like the bottom had fallen out.
In a year in which we actively limited risk exposure in the portfolios, we were not surprised to lag the broader markets. What we did not expect was the now historic run of positive performance: With data going back 90 years, 2017 was the first calendar year on record in which the S&P 500 TR did not have a single negative month. Volatility was also unusually low last year, with the VIX index reaching as low as 8.84 in July. When there are no pullbacks to speak of and risk (as measured by volatility) is conspicuously absent, a hedged strategy that is intended to reduce risk will not normally enhance portfolio returns. The question we have asked ourselves for as long we can remember is, how long can this continue? We know that it is impossible to consistently time market corrections right, and the many people who try end up jumping in or out either too early or too late.

* * *
“If you’re offered a seat on a rocket ship, don’t ask what seat. Just get on.”
- Sheryl Sandberg
Up until very recently, we have witnessed an almost unprecedented “bull capitulation” – bearish investors becoming bulls simply because they have grown weary of being wrong. The chart below reflects this. Indeed, prior to the recent pullback, the spread between bulls and bears had grown to its largest since April 1986:

Source: Yardeni Research, Inc., Stock Market Indicators: Bull/Bear Ratios, February 7, 2018
Then, beginning early this month, the market began to fall and, within a week, the ratio of bulls to bears dropped by one-third. Bulls becoming bears overnight begs the question: If so many investors were bullish when the S&P 500 reached a record high on January 26th, what caused so many of them to turn bearish in the week that followed? Should not those bulls feel even more bullish when prices are lower? The short answer, of course, is that bulls often become bears after a pullback, not before.
What is most remarkable about the markets last year and well into January was that few seemed to question whether stocks had gotten overpriced. (To his credit, Peter Oppenheimer of Goldman Sachs was one of the minority recent nay-sayers: he wrote on January 22nd that “correction signals are flashing” and that there was a “high probability” that there would be a pullback “in the coming months.”) We have been concerned about valuations for a long time, a view that has grown increasingly lonely over time. Indeed, on January 8th, the Wall Street Journal ran an article with the following headline:
As Stocks Reach New Highs, Investors Abandon Hedges:
With volatility at consistently low levels, more are revising their strategies…
- The Wall Street Journal, January 8, 2018
Now with the benefit of 20/20 hindsight, that headline alone captures the pitfalls of market timing. The data, unfortunately, points to the fact that many investors believe they can time the market. According to EPFR Global, for the seven-day period ending January 24, equity funds posted a new weekly INFLOW record, breaching the $30 billion mark for only the second time since EPFR started tracking them in 1995. As the S&P 500 TR surged over 7% in January, investors were piling in. Then, just two weeks later – two weeks! – EPFR data indicated a new record, for the seven-day period ending February 7, equity funds posted a new weekly OUTFLOW record. Moreover, it was not just retail investors: Bank of America reported on February 6th that hedge funds sold stocks during the turmoil at the highest pace since June 2016, the period leading up to the Brexit vote. What a difference a week makes!
What does this all tell us? In short, we think too many investors – including professionals managing billions of dollars – are making investment decisions for reasons other than security fundamentals. Howard Marks, someone we greatly respect, captured this well in his latest letter, written before the latest turmoil:
“It appears many investment decisions are being made today on the basis of relative return, the unacceptability of the returns on cash and Treasurys, the belief that the overpriced market may have further to go, and FOMO. That is, they’re not being based on absolute returns or the fairness of price relative to intrinsic value.”
- Howard Marks, Latest Thinking, January 24, 2018
We agree that this FOMO or “fear of missing out” has become (until very recently) a big part of investors’ mindsets and why equity prices had continued to rise. Indeed, as we were preparing this letter and developing this theme (incidentally, before the recent volatility), Bloomberg ran the attached cover to capture what they call this “investing dilemma”:

Source: Bloomberg BusinessWeek
At the risk of wading into deep socio-demographic waters, we think that this shift away from fundamentals can be blamed, at least in part, to a de-coupling of information and reality in the so-called information age. In particular, we believe that social media creates an unreal world. In the digital age, Facebook, Instagram, Snapchat, etc. are all becoming the primary source of “information” about what is going on. However, reality is not endless exotic vacations, glamorous social lives, or children who are all well-behaved, well-groomed overachievers (as parents, we know that to be the truth!). Reality is much more mundane and a lot less pretty.
This disconnect between reality and perceptions feeds into the “fear of missing out” that Howard Marks pointed to among investors. To put it more bluntly, everyone making money in the markets was not – and is not – reality. Many investors overlook the fact that the broader equity market returns do not necessarily align with individual investor returns. An analysis by Lipper and DALBAR conducted a few years ago finds that the average equity investor return was only about half of the S&P 500 return:

Just as individual perceptions separate from reality, so too do stock prices. According to a recent Goldman Sachs study, stocks are now trading more without regard to macro factors than any time since the tech bubble in 2001. The same study found that today approximately 77% of the stocks in the S&P 500 trade on fundamentals, down from 95% a decade ago.
So how do we invest in this environment? We continue to focus on managers who can navigate these cross currents and exploit opportunities while maintaining downside protection. In an ever increasingly complex and unpredictable world, it is more important than ever to have a significant portion of our portfolio in hedged strategies. As we discuss more below, we believe the recent volatility can only be characterized as a short term shakeout; there may be greater drops to follow, we just do not know. It is kind of like in early February, we may have trimmed the foam off the top of the beer but the bubbles inside remain. (Andrew Sheets, chief cross-asset strategist at Morgan Stanley, using another metaphor, recently said on CNBC that the correction was an "appetizer, not the main course.") Given our uncertainty about the future and the significant risks we see, we are happy to be truly hedged and give up some upside in exchange for potential protection against permanent capital loss.
We came across a note recently, excerpted below, and thought the sentiment was worth sharing:
“The most important lesson I’ve learned over time is that you have to contain your emotions. It’s not easy to do on the way up, and it’s not easy to do on the way down, but it is your enemy in terms of creating wealth over time. Sticking with the fundamentals, employing good asset allocation, and maintaining a balanced portfolio with a long-term horizon is the best approach.”
- Tim Armour, Capital Group
Expectations
“Where should I go?” – Alice
“That depends on where you want to end up.” – The Cheshire Cat
Alice’s Adventures in Wonderland, Lewis Carroll (1865)
Although we have no idea where the market is going from here, we do believe we are more realistic about future returns than most investors. In November, Schroders published a report that found that across the globe, investors expect an annual return of 10.2% on their investment portfolio over the next five years. For investors in the United States, the study summarized return expectations as follows:

Source: Schroders Global Investor Study 2017; US Investors.
What perhaps is most notable is that more than 20% of respondents expect annual returns over the next five years of more than 20%. (We are thinking maybe they concentrated their polling in states that have legalized marijuana!)
This optimism is sharply at odds with the outlooks offered by most professional prognosticators. In early January, Robeco published its expected returns for the next five years (2018-2022) and forecasted that equities in developed markets would return 5% annually. If equities return 5% over the next five years, we wonder how individuals will get 10%+ on their portfolio... Most professional forecasters are, we believe, more realistic than many investors, at least the ones polled by Schroders:

This disconnect between expectations for the future and what we believe is realistic is not unlike the disconnect between current perceptions of reality in the markets and the truth of what is really going on discussed above. Unfortunately, so long as these gaps remain (and we see no signs of them going away), we will have challenging markets to execute fundamentals-based strategies. For that reason, remaining hedged against what cannot be foreseen or which does not necessarily make sense is more important than ever. In that regard, we came across a neat variation (below) of what we call “the power of negative numbers,” a table we include with every letter we write (including this one). In a world where major drawdowns are unpredictable, it always helpful to remember what it takes to recoup losses:

Source: The Long View
In short, we believe that investors have been lulled into complacency about the real risks in the markets and have lost sight of the “power of negative numbers.” That is not surprising when you consider how truly remarkable 2017 was in the stock market for the S&P 500 and the Dow:
- According to a report on CNBC, the average daily change in the S&P 500 for all of 2017 up or down was just 0.30% – the lowest number since 1964. Moreover, as we alluded to at the outset of this letter, the average observed one-month volatility in the S&P 500 in 2017 was unprecedented, lower than any other year since 1970. In fact, of the 56 lowest closing levels in the history of the VIX (since 1990), 47 or 84% of them occurred in 2017. Likewise, in terms of pullbacks, there were really none to speak of. (Incidentally, on Monday, February 5th, the longest streak of trading days without a 5% pullback in the S&P 500’s history came to an end.)
- As for the Dow, there were many reports in 2017 and early 2018 about the index breaking records and gaining 1000 points in record time. For the first time, in just one year, the Dow achieved 70 new highs and reached four 1000 point milestones. On January 4th, the blue-chip benchmark closed above 25,000 in a record 23 trading days, the fastest rally to such a mark at the time. That was one day faster than the 24 sessions it took to reach 21,000 last March and the move to 11,000 back in May 1999. It is, however, helpful to note that the Dow actually rose more than 1000 points intraday (ONE DAY!) on February 6th and February 9th.
Moreover, although 2018 seems much more volatile, at worst the markets are performing more in line with as they have since inception. In particular, through February 10, the average daily change, up or down, of the S&P 500 had been 0.84%. While that is a big increase over the record numbers in 2017 noted above, going back to 1928, the average has been 0.75%, according to Ryan Detrick at LPL Financial. As he has pointed out, the current market in 2018, which has been depicted as disruptive, has really just reverted to an average one. Indeed, despite some of the hysteria that accompanied the market volatility during the week of February 5th, it is helpful to keep what happened in perspective relative to other drops in recent times:

Likewise, even though the 1,175 drop of the Dow on February 5th and the 1,033 fall on February 8th were the two largest ever measured in terms of points, neither was even in the top 20 on a percentage basis. That, however, did not stop a lot of worrying, with reports mid-day on Friday, February 9th warning that the Dow was on track for its worst week since October 2008 (it closed higher to avoid that distinction). The bottom line is that while the market swings of early February were dramatic, they pale in comparison to a truly significant pullback that hedged strategies are designed to mitigate. As noted above, we do not believe anyone can time the market and in this environment, we believe a large portion of our portfolio should remain in strategies that are designed to mitigate risk.
Market Observations
When we talk about being concerned about the markets and that the recent volatility may only be a moderate precursor of what is to follow, here are some of the things we are thinking about:
- The Relative Strength Indicator: We are not avid followers of technical signals, but one that caught our eye in the period leading up to the recent selloff was the Relative Strength Indicator (RSI). The RSI is a technical indicator originally proposed by J. W. Wilder in the book New Concepts in Technical Trading Systems (1978). A high RSI value indicates strong upward price momentum and overbought conditions. For the Dow, in January, the monthly RSI was higher than it has ever been in the past 100 years. Similarly, the S&P 500 was at near record levels (the highest levels ever for the monthly RSI on the S&P index occurred in the years 1927-1929 just before the Great Depression began). Moreover, each time the RSI peaked, strong selloffs – far greater than what we just experienced – followed, as shown below over the last 20 years:

Source: Seeking Alpha
- Debt multiples at highest rate in over a decade. Pitchbook issued data recently demonstrating that valuations remain as high as ever, leveling at last year’s 10.5x. However, what is more troubling is that 2017’s debt-to-equity multiple of EBITDA rose. In fact, through the third quarter, the 5.8x debt/EBITDA level was at its highest in more than ten years. This greatly concerns us since the increase use of debt (leverage) to pay for companies exponentially increases risk when (not if) the M&A market cools.
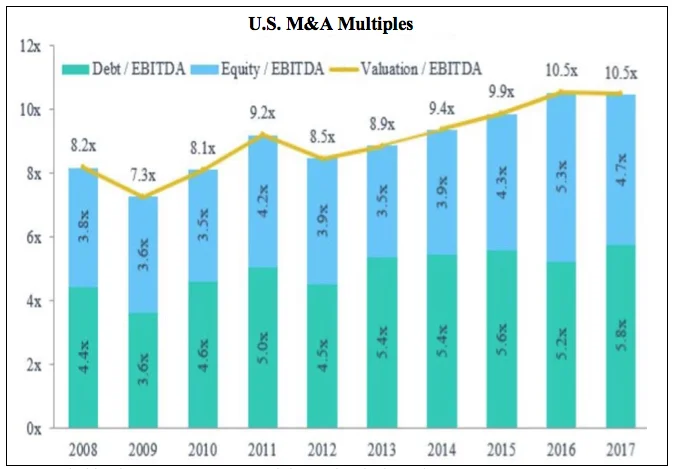
Source: Pitchbook 3Q 2017 US PE Breakdown, data is through Sept. 30.
- Average consumer is stressed. Just as buyers of companies are increasing debt, so too are consumers. Total household debt recently rose to an all-time high of $13.15 trillion at year-end 2017, according to the Federal Reserve Bank of New York's Center for Microeconomic Data. Likewise, new Chapter 11 bankruptcies in the U.S. more than doubled in December 2017 from a year ago. The increase of filings from December 2016 was the largest year-over-year jump since the financial crisis:

Moreover, there are pockets of the consumer economy under stress that in some respects are in the least likely places. For example, in their annual foreclosure report, PropertyShark reported that in 2017, foreclosures in New York City reached their highest level since 2009. More than 3,300 homes in the City were scheduled for auction, representing a 58% year-over-year increase.
- A more obscure measure: S&P 500 as a multiple of hourly earnings. Thanks to Seeking Alpha, we came across one interesting way to consider the recent price level of the S&P 500 is to compare it to average hourly earnings. At its high on January 26, it would take the average worker 129 hours to purchase the index level of 2,873. That is the highest multiple of all-time, exceeding the previous high of 108 hours in March 2000, when the tech bubble was about to burst:
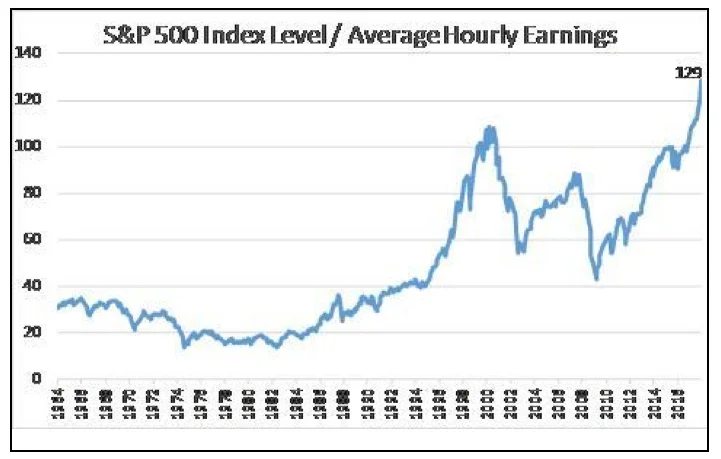
Source: Seeking Alpha, as of January 26th
A Postscript on Bitcoin
We included a short note about bitcoin in our last quarterly letter, expressing skepticism and quoting Art Cashin, who had said on CNBC that “we’re in the fear-of-missing-out phase now.” At the time of our letter, bitcoin traded at about $8,000. After we wrote our letter, in December, the price peaked at $19,000 – and then as of mid-February it stood at … back around $8,000. Stay tuned for more ups and downs!
We welcome any questions or thoughts you may have.
Sincerely,
Alternative Investment Management, L.L.C.